August 21, 2014
Reliability is a broad topic, broad enough to be thesis worthy. So, when I set out to summarize “all things reliability”—in two pages, no less—I didn’t know where to start. Naturally, I procrastinated. When my problem didn’t magically go away on its own, I realized I only needed to reflect on the interactions I’ve had with educators, and here we are!
In my previous blog post on reliability and validity, we defined reliability as the consistency of test scores across multiple test forms or multiple testing occasions. Because there are various types of reliability, it follows that educators want to know which type is relevant to their testing scenario as well as what degree of reliability is considered acceptable. Simple enough, right?
Before we proceed, I’ll introduce a statistic that we psychometricians use to quantify reliability. Don’t worry, you’ll like this one! Because once you get it, you’ll have the key to understanding the numbers people use to cite the degree of reliability for any test scores. I’ll simply refer to this statistic as a correlation coefficient. Let’s spell out the two ideas contained in this term:
- Correlation – When it comes to reliability, think of the correlation as the way we determine whether a test ranks students in a similar manner based on their scores across two test forms or two separate measurement occasions.
- Coefficient – The coefficient comes in when we assign a number to the correlation. The reliability coefficient is the number we use to quantify just how reliable test scores are.
What is an acceptable level of reliability?
Reliability is a matter of degree, with values (correlation coefficients) ranging from 0 to 1. Recall from my previous blog post that reliable weight readings might look like the dots in this wheel.
The dots are slightly scattered because no measurement is without some degree of uncertainty, not even your bathroom scale! As a result, perfect reliability—a correlation coefficient of 1—doesn’t exist. That said, higher reliability values are preferred. Psychometric literature cites .70 or greater as acceptable. Needless to say, you may want values greater than, say, .85 for high-stakes decisions such as grade promotion or placement for special education services, among others.
To really understand reliability, understanding correlation coefficients and their acceptable levels is a start. Next, you should know what type of reliability is most relevant to the type of test in question and your testing situation.
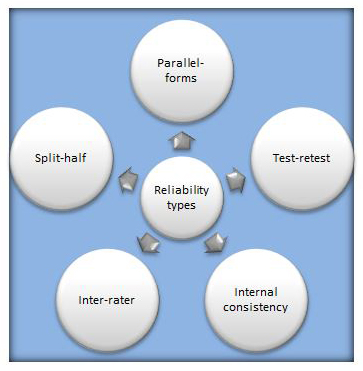
Types of reliability
Suppose you want to test algebra skills, and you have two algebra test forms, each made up of 34 multiple-choice items. The two forms are designed to be as similar as possible, and it shouldn’t matter which form you use. One way psychometricians determine the consistency of scores across the two forms is to test the same students with both forms and compute the correlation coefficient for the two sets of scores. This correlation is called parallel-forms reliability.
Now suppose you have only one form of the algebra test. To determine whether scores from this single test form are consistent, we administer the test twice to the same group of students. The correlation coefficient relating these scores is called test-retest reliability. To put this in the context of the Star assessments, both Renaissance Star Math and Renaissance Star Reading have aggregate test-retest reliability greater than .90.
In our busy classrooms, teachers may have time to administer a single algebra test form once, not twice! It may seem paradoxical to judge score consistency from a single test administration, but we can do this by using one of two approaches: split-half reliability or internal consistency reliability.
The Split-half reliability approach splits student responses on the 34 algebra items into two halves, scores the halves, and computes a correlation coefficient between the two sets of scores.
Internal-consistency reliability, the other approach, treats each item as a single administration. So our 34 algebra items would be viewed as 34 different test administrations! We want all 34 items to correlate highly with one another so that high-ability students tend to score high on each item and low-ability students tend to score low on each item. The Star assessments have a high degree of internal consistency; overall, it’s .85 for Renaissance Star Early Literacy and .97 for both Star Math and Star Reading.
Finally, not all tests are made up of multiple-choice items. Sometimes tests will administer essays or ask students to perform some tasks to demonstrate certain abilities. A human judge is needed to score an essay or judge performance quality. Two judges will usually judge the same task. In these cases, we are concerned with the degree of agreement between the judges in assigning scores to show inter-rater reliability.
From our discussion you can probably see that the reliability measure of interest depends on your specific testing plan. You don’t need all of the reliability types discussed above to judge the consistency of test scores. For example, if your program administers multiple-choice tests in a single administration, then internal consistency reliability should be enough. On the other hand, if you use assessments that require human scorers, you should look at inter-rater reliability.
Reliability and computerized adaptive tests
Another note is that computerized adaptive tests (CATs)—such as Star—are different from fixed-form tests such as paper-and-pencil tests. Students see different items with each CAT administration, whereas the items in the fixed forms remain the same. This presents challenges when using reliability labels that were originally designed for the traditional non-adaptive fixed forms. For example, test-retest reliability for an adaptive assessment presents the same test but with mostly different items on retest. You might want to refer to test-retest for CATs as “alternate-forms reliability,” but that term happens to also be the synonym for parallel-forms reliability! In addition, psychometricians have to compute a different type of internal consistency measure for adaptive tests (other than the usual Cronbach’s alpha approach that requires the same items in each test). I hope curious readers will appreciate knowing about the labeling dilemma surrounding CATs and reliability, as well as the need to compute reliability values specific to CATs.
Do educators play a role in ensuring the reliability of test scores?
Yes, they do! Test publishers report the reliability values obtained under standardized administration conditions devoid of as many distractions as possible. Departure from these administration conditions could and does introduce unwanted uncertainties that make scores less consistent. By ensuring fidelity of assessment administration, educators can be confident that they are doing their best to maintain test-score consistency.
Now that you know what to look for in test-score consistency, you have a solid foundation in reliability. Next up, we will learn how validity evidence provides further assurance of test score quality. I hope you look forward to that final post in my series on the basics of reliability and validity.
Learn more
To learn more about the power of Renaissance Star Assessments, click the button below.


