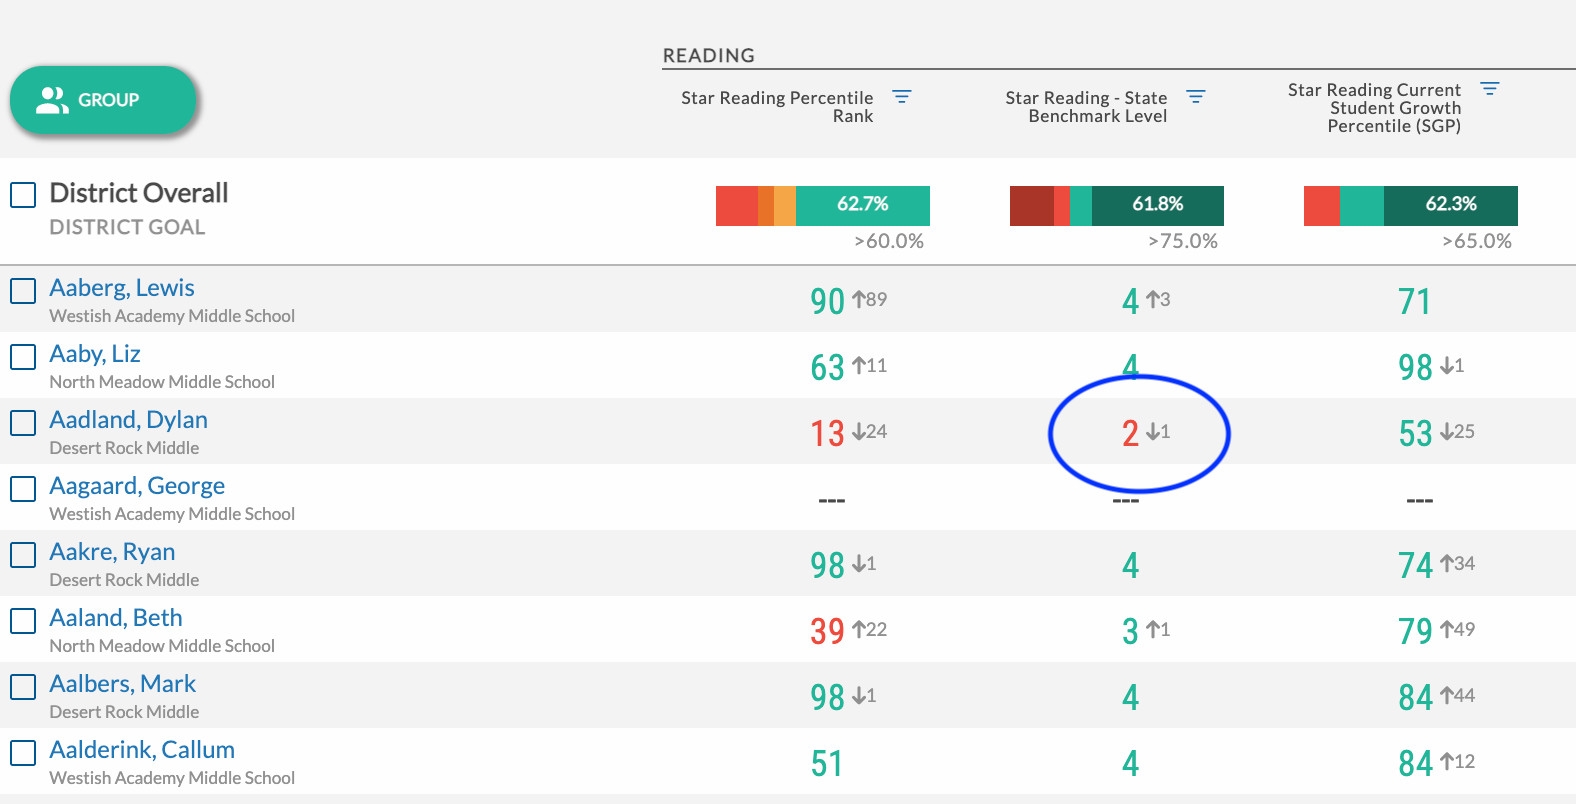
Enhanced progress monitoring in Our Students dashboard
Starting in January, Schoolzilla customers will see an exciting change to their student data to help teams monitor progress and determine the next steps to support students and achieve strategic goals. You now can compare—at a quick glance—how students progressed since the last period. This comparison enables you to answer key questions such as:
- Which of my lowest-performing students improved since last period?
- Which students in my intervention group realized gains since last period?
- Which students in a particular risk category saw further decline in outcomes?
The change in progress is indicated with an arrow and number situated to the right of each student data point with the direction and amount of change displayed in gray:

In addition, when hovering over a student metric, a tooltip will now display helpful details about the change in value.

Here’s how it works: The change values are calculated against a single, prior data point. Students with a periodic assessment taken multiple times in the same test window or marking period will only have one score considered for comparison against the last screening window. When there is no change between current and prior data point, users will not see arrows or numbers next to the current data value.
Gathering data to inform daily instruction is even more important right now—especially if you’re teaching remote or hybrid classes. Being able to quickly assess recent changes to student data can be useful in deciding which students may need additional supports or in monitoring progress for students already receiving extra help.
This update gives you even more insight into each one of your students, informing your decision-making in the classroom and ensuring success for ALL.


